import pandas as pd
from matplotlib import pyplot as plt
import seaborn as sns

# retrieve data set from web
url = "https://raw.githubusercontent.com/PhilChodrow/PIC16B/master/datasets/palmer_penguins.csv"
penguins = pd.read_csv(url)In this post, we will walk through how to make data visualizations using the Palmers penguins dataset.
Setting Up Our Analysis
First, we will import the libraries that are used to store the data and create the plots. Then, we will obtain the data from the Palmer penguins dataset.
Data Exploration
Here, we are looking at the first few rows of the penguins dataset so that we understand which features were recorded. For this tutorial, we will be comparing the body masses of the penguins across the three islands that they were measured on.
penguins.head()| studyName | Sample Number | Species | Region | Island | Stage | Individual ID | Clutch Completion | Date Egg | Culmen Length (mm) | Culmen Depth (mm) | Flipper Length (mm) | Body Mass (g) | Sex | Delta 15 N (o/oo) | Delta 13 C (o/oo) | Comments | |
|---|---|---|---|---|---|---|---|---|---|---|---|---|---|---|---|---|---|
| 0 | PAL0708 | 1 | Adelie Penguin (Pygoscelis adeliae) | Anvers | Torgersen | Adult, 1 Egg Stage | N1A1 | Yes | 11/11/07 | 39.1 | 18.7 | 181.0 | 3750.0 | MALE | NaN | NaN | Not enough blood for isotopes. |
| 1 | PAL0708 | 2 | Adelie Penguin (Pygoscelis adeliae) | Anvers | Torgersen | Adult, 1 Egg Stage | N1A2 | Yes | 11/11/07 | 39.5 | 17.4 | 186.0 | 3800.0 | FEMALE | 8.94956 | -24.69454 | NaN |
| 2 | PAL0708 | 3 | Adelie Penguin (Pygoscelis adeliae) | Anvers | Torgersen | Adult, 1 Egg Stage | N2A1 | Yes | 11/16/07 | 40.3 | 18.0 | 195.0 | 3250.0 | FEMALE | 8.36821 | -25.33302 | NaN |
| 3 | PAL0708 | 4 | Adelie Penguin (Pygoscelis adeliae) | Anvers | Torgersen | Adult, 1 Egg Stage | N2A2 | Yes | 11/16/07 | NaN | NaN | NaN | NaN | NaN | NaN | NaN | Adult not sampled. |
| 4 | PAL0708 | 5 | Adelie Penguin (Pygoscelis adeliae) | Anvers | Torgersen | Adult, 1 Egg Stage | N3A1 | Yes | 11/16/07 | 36.7 | 19.3 | 193.0 | 3450.0 | FEMALE | 8.76651 | -25.32426 | NaN |
Creating Plots
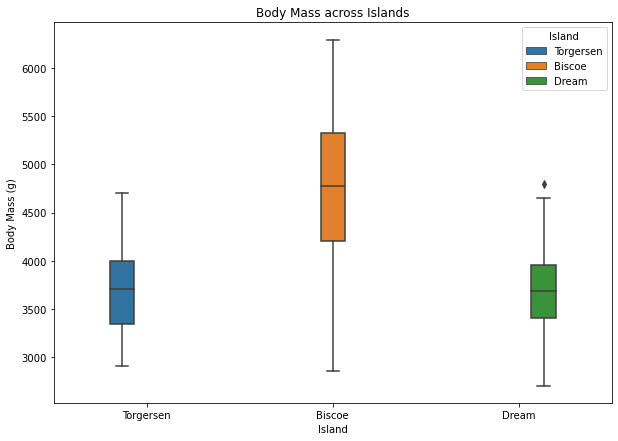
In order to compare the body masses across islands, we will use a boxplot, as it will allow us to see the median and the distribution of the body masses. The library that is used will be seaborn, and we will set Island as the x-axis and Body Mass as the y-axis. To make the plot easier to read, we will also set the hue to Island.
fig,ax=plt.subplots(figsize=(10,7))

# create boxplot
fgrid = sns.boxplot(x="Island",
            y="Body Mass (g)",
            hue = "Island",
            data = penguins,
            width = 0.4,
            dodge=True,
           )

# make title
fgrid.set_title("Body Mass across Islands")
Text(0.5, 1.0, 'Body Mass across Islands')